Part III: Predictions
In this part, we will focus on generating prospects for various production items. In the end, we also produce predictions on the emissions, based on future production.
1. What are the predictions for the future with the current model ?
After having deeply studied the different sources of emissions, it comes to sense to start predicting what the emission and production aspects would look like in the coming years.
Predicting time series can be done using a LSTM (Long Short-Term memory) neural network. We use a simple 2 layer network that trains over all the different times series (different items) for the world, and predict for an arbitrary number of years in the future.
Predictions will be done on a worldwide level.
We will start by predicting the amount of live animals for the coming years, using the method described above.
1.1. Live animals
The number of living animals on earth (used for agriculture) is increasing, and as seen previously, they tend to have a significant effect on emissions (cattle were responsible for more than 50% of Enteric Fermentation emissions). Of course, the increase is correlated with the increase in population. However, to simplify our models, we will simply try and predict the number of animals in the coming years simply based on their history.
For this, we have trained a LSTM model (2 layers followed by a fully connected layer) for each (item, element) pair in the Live animals. For the sake of readability, we will not include the training of models in this notebook, but it can be found in the source code (fao_ada/predictions).
All predictions are up to the year 2030.
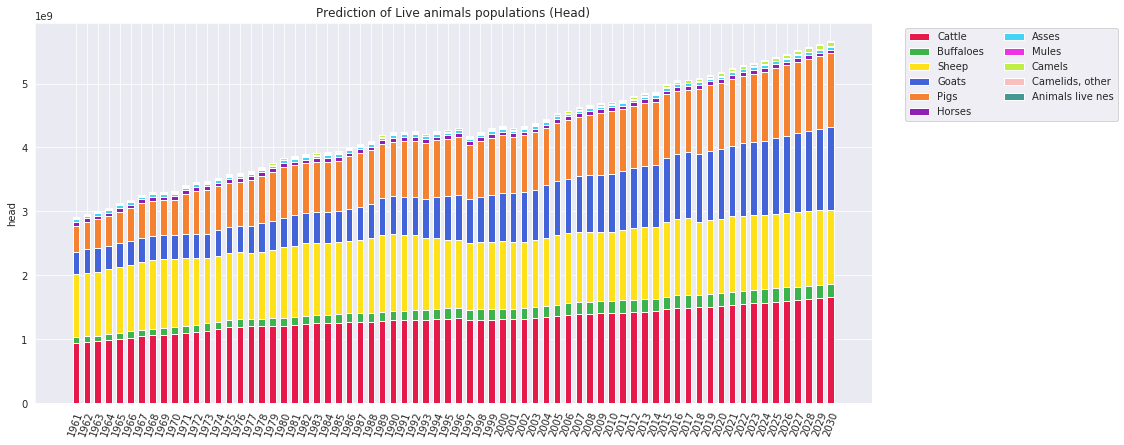
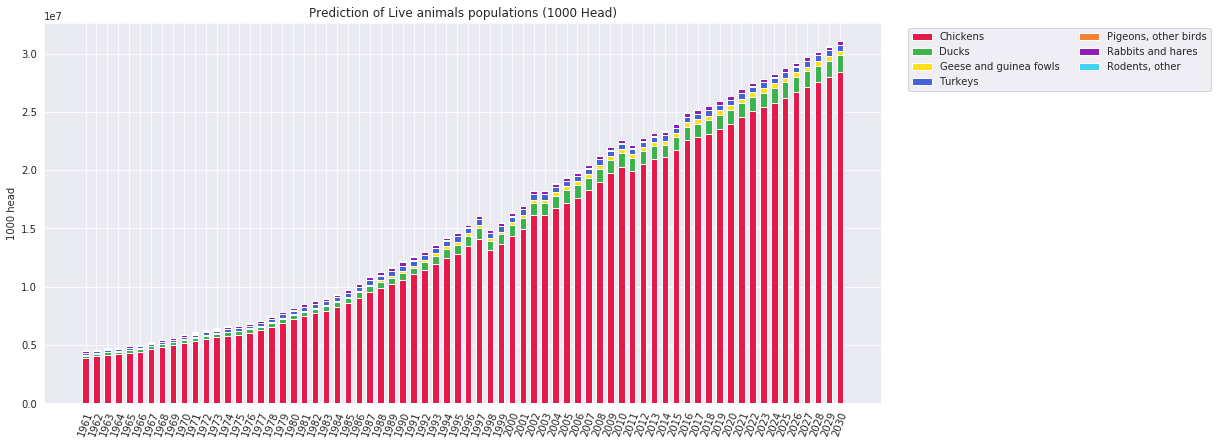
For most items, the error is quite small (less than 1%) and higher errors (up to 7%) appear for items that do not seem very important. Those models were trained independantly from the predictions on population, but it is a simplifaction choice we did. Hence, the predictions assume a similar increase of population as for the past years.
We can notice a few things:
- Cattle population seems to stagnate, with a relatively low increase in the next decade.
- Goats and pigs on the other hand, seem to increase quite a lot. This makes sense, as we are eating more and more products derived from those animals.
- The most significant increase is at the Chicken population. Earlier in our analysis, we saw an increase in Chicken population in the past years, and since the model fits over current values, it makes sense to project that the Chicken population will keep increasing.
1.2. Crops
Since we do not have a lot of data concerning the emissions due to crop, we will only focus on predicting the production of 12 items: Barley, Maize, Millet, Potatoes, Rice, Wheat, Dry beans, Oats, Rye, Sorghum, Soybeans and Sugar cane.
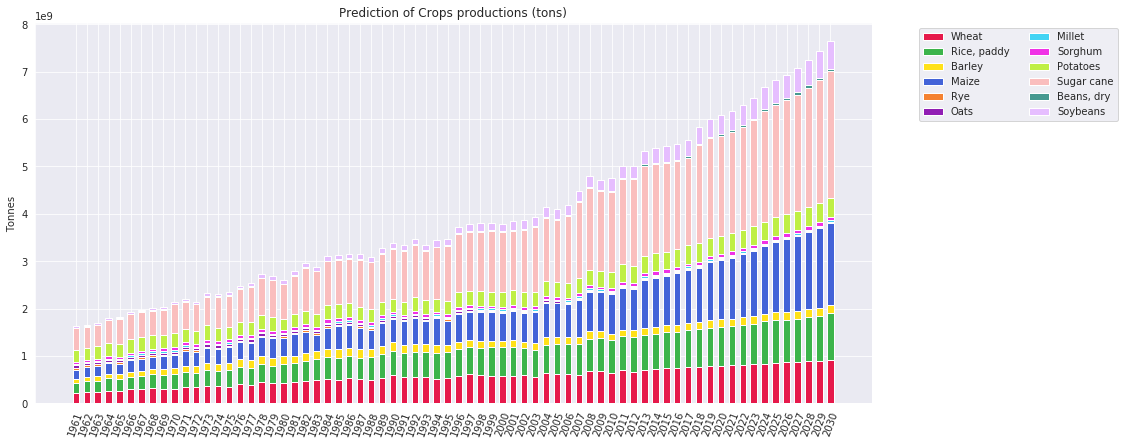
Again, for most items, the error margin is quite small. The models were trained in the same way as for Live animals, without taking into account the evolution of human population.
The production of Maize seems to increase quite a bit during 2020-2030 decade, and the same goes for Sugar Cane production.
Now that we have done those predictions on production, our next step would be to estimate future emissions due to those productions. We will describe how this is done in the subsequent steps.
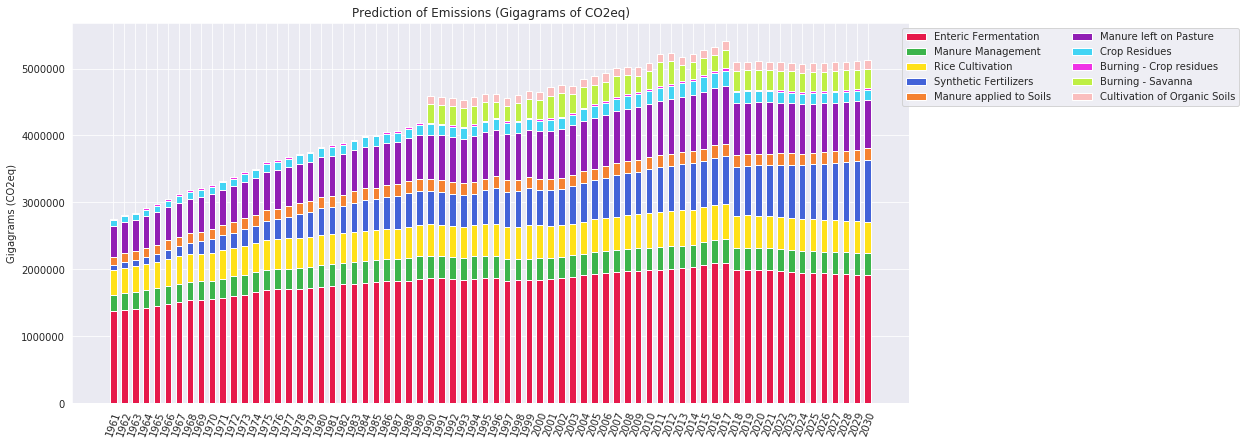
1.3. Emissions
As seen in part II.1, there are 6 different emission types that are due to Live animal population and crop production. For that, we will train a regressive neural network that will learn to estimate the 6 types of emissions based on the population of animals.
However due to time constraints, we could not train such a model, but believe it would be rather precise and would give us a nice idea of future predictions.
We instead projected the emissions using the same model architecture as above.